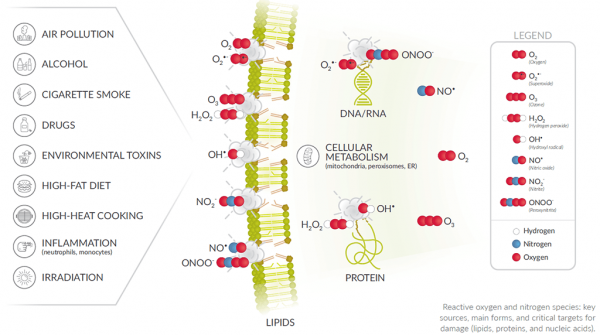
Oxidative stress can be evaluated directly by measuring reactive oxygen species (ROS) or indirectly by the associated damage to lipids, proteins, and nucleic acids that occurs upon overproduction of ROS. Although direct measurement of ROS is ideal, the indirect methods are often relied on more heavily due to the relative stability of damage markers on biomolecules compared to the transient nature of ROS. To help you determine which is best to use in your experimental system, here is a breakdown of the assay technology used to detect the most common oxidative damage biomarkers.
ROS
Oxygen is electronically reduced as part of normal metabolism, resulting in the formation of various ROS, including hydrogen peroxide (H2O2) and superoxide (O2•−). Damage to cellular macromolecules occurs when uncontrolled oxidation stresses a biological system. Assays for ROS do not discern the source of ROS production (i.e., normal versus disease state), but if the experimental model is under stress, an increase in ROS and alteration to molecular components is probable.
H2O2
H2O2 can be detected using sensitive probes such as ADHP coupled to an enzyme like HRP. Assay specificity is improved significantly when an H2O2 scavenger, such as catalase, is included as a control.1
Dihydroethidium
Dihydroethidium (hydroethidine or DHE) can be used directly in live cells. This redox-sensitive probe is oxidized by O2•− to form 2-hydroxyethidium (ex: 500-530, em: 590-620 nm) or by non-specific oxidation by H2O2 or other sources of ROS to form ethidium (ex: 480 nm, em: 576 nm).2,3
Xanthine Oxidase
Xanthine oxidase (XO) produces both H2O2 and O2•−.1 The activity of this enzyme can be measured by allowing XO to degrade hypoxanthine and capturing the H2O2 byproduct of this reaction via a probe like ADHP coupled to an enzyme like HRP. 2,3
RNS
Reactive nitrogen species (RNS) are also produced during oxidative stress. High levels of nitric oxide (NO•), synthesized by nitric oxide synthase (NOS), and O2•− lead to the formation of peroxynitrite. NO• itself also reacts with thiols and iron-sulfur enzymes, whereas peroxynitrite reacts with tyrosine residues to form nitrotyrosine.4,5
Nitrate (NO3−)/Nitrite (NO2−)
NO3− and NO2− are end products of in vivo NO• reactions whose total production can be detected using either Griess reagents or DAN.4,5 These assays first convert NO3− to NO2−using NADPH-dependent nitrate reductase. Subsequent reaction with Griess reagents or DAN, both of which only react with NO2− , will determine a total concentration of NO2−.
NOS
NOS activity is detected in tissues and cells by harnessing the NOS-driven conversion of a radiolabeled arginine to citrulline in the presence of the necessary factors. Alternatively, in vitro NOS activity can be detected using the chemistry of the Griess reaction once the excess NADPH, added as a cofactor for NOS activity, is removed using an oxidization step that is catalyzed by lactate dehydrogenase.
DNA/RNA Damage
Guanine is the base that is most prone to oxidation when DNA and RNA are damaged. The repair processes that are initiated to correct this damage release the following oxidized guanine species into the urine:
- 8-Hydroxyguanine — the ribose-free base
- 8-Hydroxyguanosine — the nucleoside from RNA
- 8-Hydroxy-2’-deoxyguanosine — the deoxynucleoside from DNA
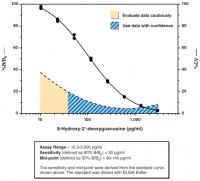
Assays that can detect multiple oxidized guanine species capture a more complete set of biologically relevant products of oxidative damage than do assays that are restricted to analysis of only one (e.g., 8-hydroxy-2'-deoxyguanosine).6-9

Figure 1: DNA/RNA damage. Note that the O2• and ONOO- molecules are representative ROS and RNS species that causes damage. Many additional species can damage DNA and RNA as well.
Protein Oxidation and Nitration
The most common marker of protein oxidation is protein carbonyl content.10 Redox cycling cations bind to proteins and, in conjunction with attack by ROS, lead to the formation of amino acid derivatives containing carbonyl groups (ketones, aldehydes). Cigarette smoke and aldehydes also introduce carbonyls into proteins. Alternatively, ROS exposure to a protein’s methionine residues generates protein methionine sulfoxide (MetO), an oxidative modification that, if not reversed by MetO reductases, is further oxidized to methionine sulfone and can lead to protein dysfunction. The presence of nitrotyrosine on proteins is used as a marker of peroxynitrite formed in vivo when NO• reacts with O2•−.12 As peroxynitrite undergoes heterolytic cleavage, freed nitronium ions nitrate protein tyrosine residues. NO• can directly modify proteins through the RNS-mediated process of S-nitrosylation wherein an NO• group binds to thiol groups of protein cysteine residues resulting in the formation of an S-NO moiety.

Figure 2: Protein damage. Note that the H2O2 and OH• molecules are representative ROS species that cause damage. Many additional species can damage proteins as well.
Carbonyl Content
A convenient technique to detect carbonyl content in protein preparations involves reaction between DNPH and protein carbonyls, which forms a Schiff base that produces a corresponding hydrazone that can be measured spectrophotometrically.
Methionine Sulfoxide (MetO)
An antibody specific for protein MetO is used to monitor oxidative modifications by detecting proteins containing MetO residues.11
Nitrotyrosine
An antibody specific for nitrotyrosine is used to detect protein nitration.
S-Nitrosylation
Protein S-nitrosylation can be directly visualized using the biotin switch technique. This method cleaves S-NO bonds (after blocking existing free thiols) to biotinylate the resulting newly formed free thiol groups.13
Lipid Peroxidation
Lipid peroxidation results in the formation of highly reactive and unstable hydroperoxides of unsaturated lipids. They can be measured either directly or assessed indirectly by the various decomposition products (e.g., alkanes, ketones, aldehydes) of unstable hydroperoxides. 8-Isoprostane, produced by random oxidation of tissue phospholipids, is currently considered one of the most reliable biomarkers of in vivo lipid peroxidation.14 It is a specific product of lipid peroxidation that is stable and levels are present in detectable quantities in all normal biological fluids and tissues. Measurement of levels esterified in phospholipids can be used to determine the extent of lipid peroxidation in target sites of interest.

Figure 3: Lipid damage. Note that the O2 and O2• − molecules are representative ROS species that cause damage. Many additional species can damage lipids as well.
Lipid Hydroperoxides (LPOs)
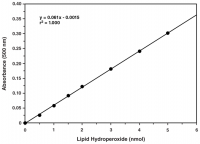
LPOs can be efficiently extracted and measured directly by utilizing redox reactions with ferrous ions to reveal the total hydroperoxide content present at a moment in time.
4-hydroxy Nonenal (4-HNE)
4-HNE protein adducts are typically more stable than MDA protein adducts. 1,4-Dihydroxynonane mercapturic acid (DHN-MA), the major urinary metabolite of 4-HNE, is an additional biomarker that may be assayed.
Malondialdehyde (MDA)
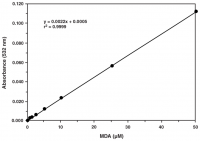
MDA assays use a thiobarbituricreaction and are thus named Thiobarbituric Acid Reactive Substances (TBARS) assays. Thiobarbituric acid reacts with various aldehydes produced during lipid peroxidation in addition to MDA.15
8-lsoprostane
8-Isoprostane, produced by random oxidation of tissue phospholipids, is currently considered one of the most reliable biomarkers of in vivo lipid peroxidation.16 It is typically assessed using either an immunoassay or LC-MS or GC-MS.
Kit Recommendations
ROS Assays
| Product Name | Sample Type | Measure | Methodology |
| Hydrogen Peroxidas Cell-Based Assay Kit | Cultured cells | Extracellular H2O2 | Plate-based fluorometric measurement (ex: 530-560 nm, em: 590 nm) |
| Mitochondrial ROS Detection Assay Kit | Live cells | Mitochondrial ROS | Plate-based fluorometric measurement (ex: 480-515 nm, em: 560-600 nm), or flow cytometer |
| ROS Detection Cell-Based Kit (DHE) | Live cells | ROS | Plate-based fluorometric measurement (ex: 480-520 nm, em: 570-600 nm), or flow cytometer |
| Xanthine Oxidase Fluorometric Assay Kit | Plasma, serum, and tissue homogenates | XO activity | Plate-based fluorometric measurement (ex: 520-550 nm, em: 585-595 nm), or flow cytometer |
RNS Assays
| Product Name | Sample Type | Measure | Methodology |
| Nitrate/Nitride Colorimetric Assay Kit | Plasma, serum, urine, tissue cultured media, and tissue homogenates | NO• metabolites | Plate-based colorimetric measurement (540-560 nm) |
| Nitrate/Nitride Colorimetric Assay Kit (LDH method) | Plasma, serum, urine, and tissue homogenates | In vitro NOS activity and NO• metabolites | Plate-based colorimetric measurement (530-550 nm) |
| Nitrate/Nitride Fluorometric Assay Kit | Plasma, serum, urine, tissue cultured media, and tissue homogenates | NO• metabolites | Plate-based fluorometric measurement (ex: 360-365 nm, em: 430 nm) |
| NOS activity Assay Kit | Cell lysates and purified preparations | NOS activity | Liquid scintillation counting |
DNA/RNA Damage Assays
| Product Name | Sample Type | Measure | Methodology |
| DNA/RNA Oxidative Damage (Clone 7E6.9) ELISA Kit | Urine (other sample types have not been validated but my be used) | 8-hydroxy-2'-deoxyguanosine and 8-hydroxy guanosine | Plate-based colorimetric measurement (405-420 nm) |
| DNA/RNA Oxidative Damage (High Sensitivity) ELISA Kit | Urine, cell culture medium, cell lysates, tissue samples, saliva and plasma/serum samples | 8-hydroxy-2'-deoxyguanosine, 8-hydroxy guanosine and 8-hydroxy guanine | Plate-based colorimetric measurement (405-420 nm) |
Protein Oxidation and Nitration Assays
| Product Name | Sample Type | Measure | Methodology |
| Protein Carbonyl Colorimetric Assay Kit | Plasma, serum, urine, tissue homogenates, and cell lysates | Protein carbonyl content | Plate-based colorimetric measurement (360-385 nm) |
| Methionine Sulfoxide Immunoblotting Kit | Plasma, CSF, cell/tissue lysates, or semi-pure/purified proteins | Proteins contaning MetO residues | Immunochemical detection by Western blot |
| Nitrotyrosine IP Kit | Cell lysates | Nitrated tyrosine content | Affinity sorbent capture and elution by Western blot or proteomic analysis |
| S-Nitrosylated Protein Detection Kit (Biotin Switch) | Whole cells or tissues | S-NO proteins | Streptavidin-based detection by Western blot or fluorescence microscopy |
| S-Glutathionylated Protein Detection Kit | Whole (permeabilized) cells | Protein-PSSG aducts | Streptavidin-based detection by flow cytometry, fluorescence microscopy, or IP/avidin overlay analysis |
Lipid Peroxidation
| Product Name | Sample Type | Measure | Methodology |
| DHN-MA EIA Kit | Urine | DHN-MA, a 4-HNE metabolite | Plate-based colorimetric measurement (405-414 nm) |
| 8-Isoprostane ELISA Kit | Plasma, serum, urine, lavage fluids, tissue homogenates, and culture medium | 8-Isoprostane | Plate-based colorimetric measurement (405-420 nm) |
| 8-Isoprostane Express ELISA Kit | Plasma, serum, urine, lavage fluids, tissue homogenates, and culture medium | 8-Isoprostane | Plate-based colorimetric measurement (405-420 nm) |
| STAT-8-Isoprostane ELISA Kit | Plasma, serum, urine, lavage fluids, tissue homogenates, and culture medium | 8-Isoprostane | Plate-based colometric measurement (405-420 nm) |
| Liquid hydroperoxide (LPO) Assay Kit | Tissues, cultured cells, plant material, food, and biological fluids | LPOs | APlate-based colorimetric measurement (500 nm) |
| Liquid hydroperoxide (LPO) Assay Kit (96 well) | Tissues, cultured cells, plant material, food, and biological fluids | LPOs | APlate-based colorimetric measurement (500 nm) |
| TBARS Assay Kit | Plasma, serum, urine, tissue homogenates and cell lysates | MDA-TBA adduct | Plate-based colorimetric measurement (530-540 nm) or fluorometric (ex 530 nm, em 550 nm) |
| TBARS (TCA Method) Assay Kit | Plasma, serum, urine, tissue homogenates and cell lysates | MDA-TBA adduct | Plate-based colorimetric measurement (530-540 nm) or fluorometric (ex: 530 nm, em: 550 nm) |
References
- Kelley, E.E., Khoo, N.K., Hundley, N.J., et al. Free Radic. Biol. Med. 48(4), 493-498 (2010).
- Michalski, R., Michalowski, B., Sikora, A., et al. Free Redic. Biol. Med. 67, 278-284 (2014).
- Zhao, H., Kalivendi, S., Zhang, H., et al. Free Radic. Biol. Med.34(11), 1359-1368 (2003).
- Green, L.C. Wagner, D.A., Glogowski, J., et al. Anal. Biochem.126, 131-138 (1982).
- Misko, T.P., Schilling, R.J., Salvemini, D., et al. Anal. Biochem. 214, 11-16 (1993).
- Gan, W., Nie, B., Shi, F., et al. Free Radic. Biol. Med.52, 1700-1707 (2012).
- Shi, F., Nie, B., Gan, W., et al. Free Radic. Res.46(9), 1093-1098 (2012).
- Roszkowski, K. and Olinkski, R. Cancer Epidemiol. Biomarkers Prev.21, 629-634 (2012).
- Weimann, A., Broedbaek, K., Henriksen, T., et al. Free Radic. Res.46(4), 531-540 (2012).
- Stadtman, E.R. and Oliver, C.N. J. Biol. Chem.266(40), 2005-2008 (1991).
- Oien, D.B., Canello, T., Gabizon, R., et al. Arch. Biochem. Biophys.485, 35-40 (2009).
- Beckman, J.S. and Koppenol, W.H. Am. J. Physiol.271, C1424-C1437 (1996).
- Jaffrey, S.R. and Snyder, S.H. Sci STKE2001(86), pl1 (2001).
- Esterbauer, H., Schaur, R. J., and Zoliner, H. Free Radic. Biol. Med.11, 81-128 (1991).
- Armstrong, D. and Browne, R. Free Radicals in Diagnostic Medicine366, 43-58 (1994).
- Roberts, L.J. and Morrow, J.D. Free Radic. Biol. Med.28, 505–513 (2000).

